Scalable Accurate Clustering for High Dimensional Data
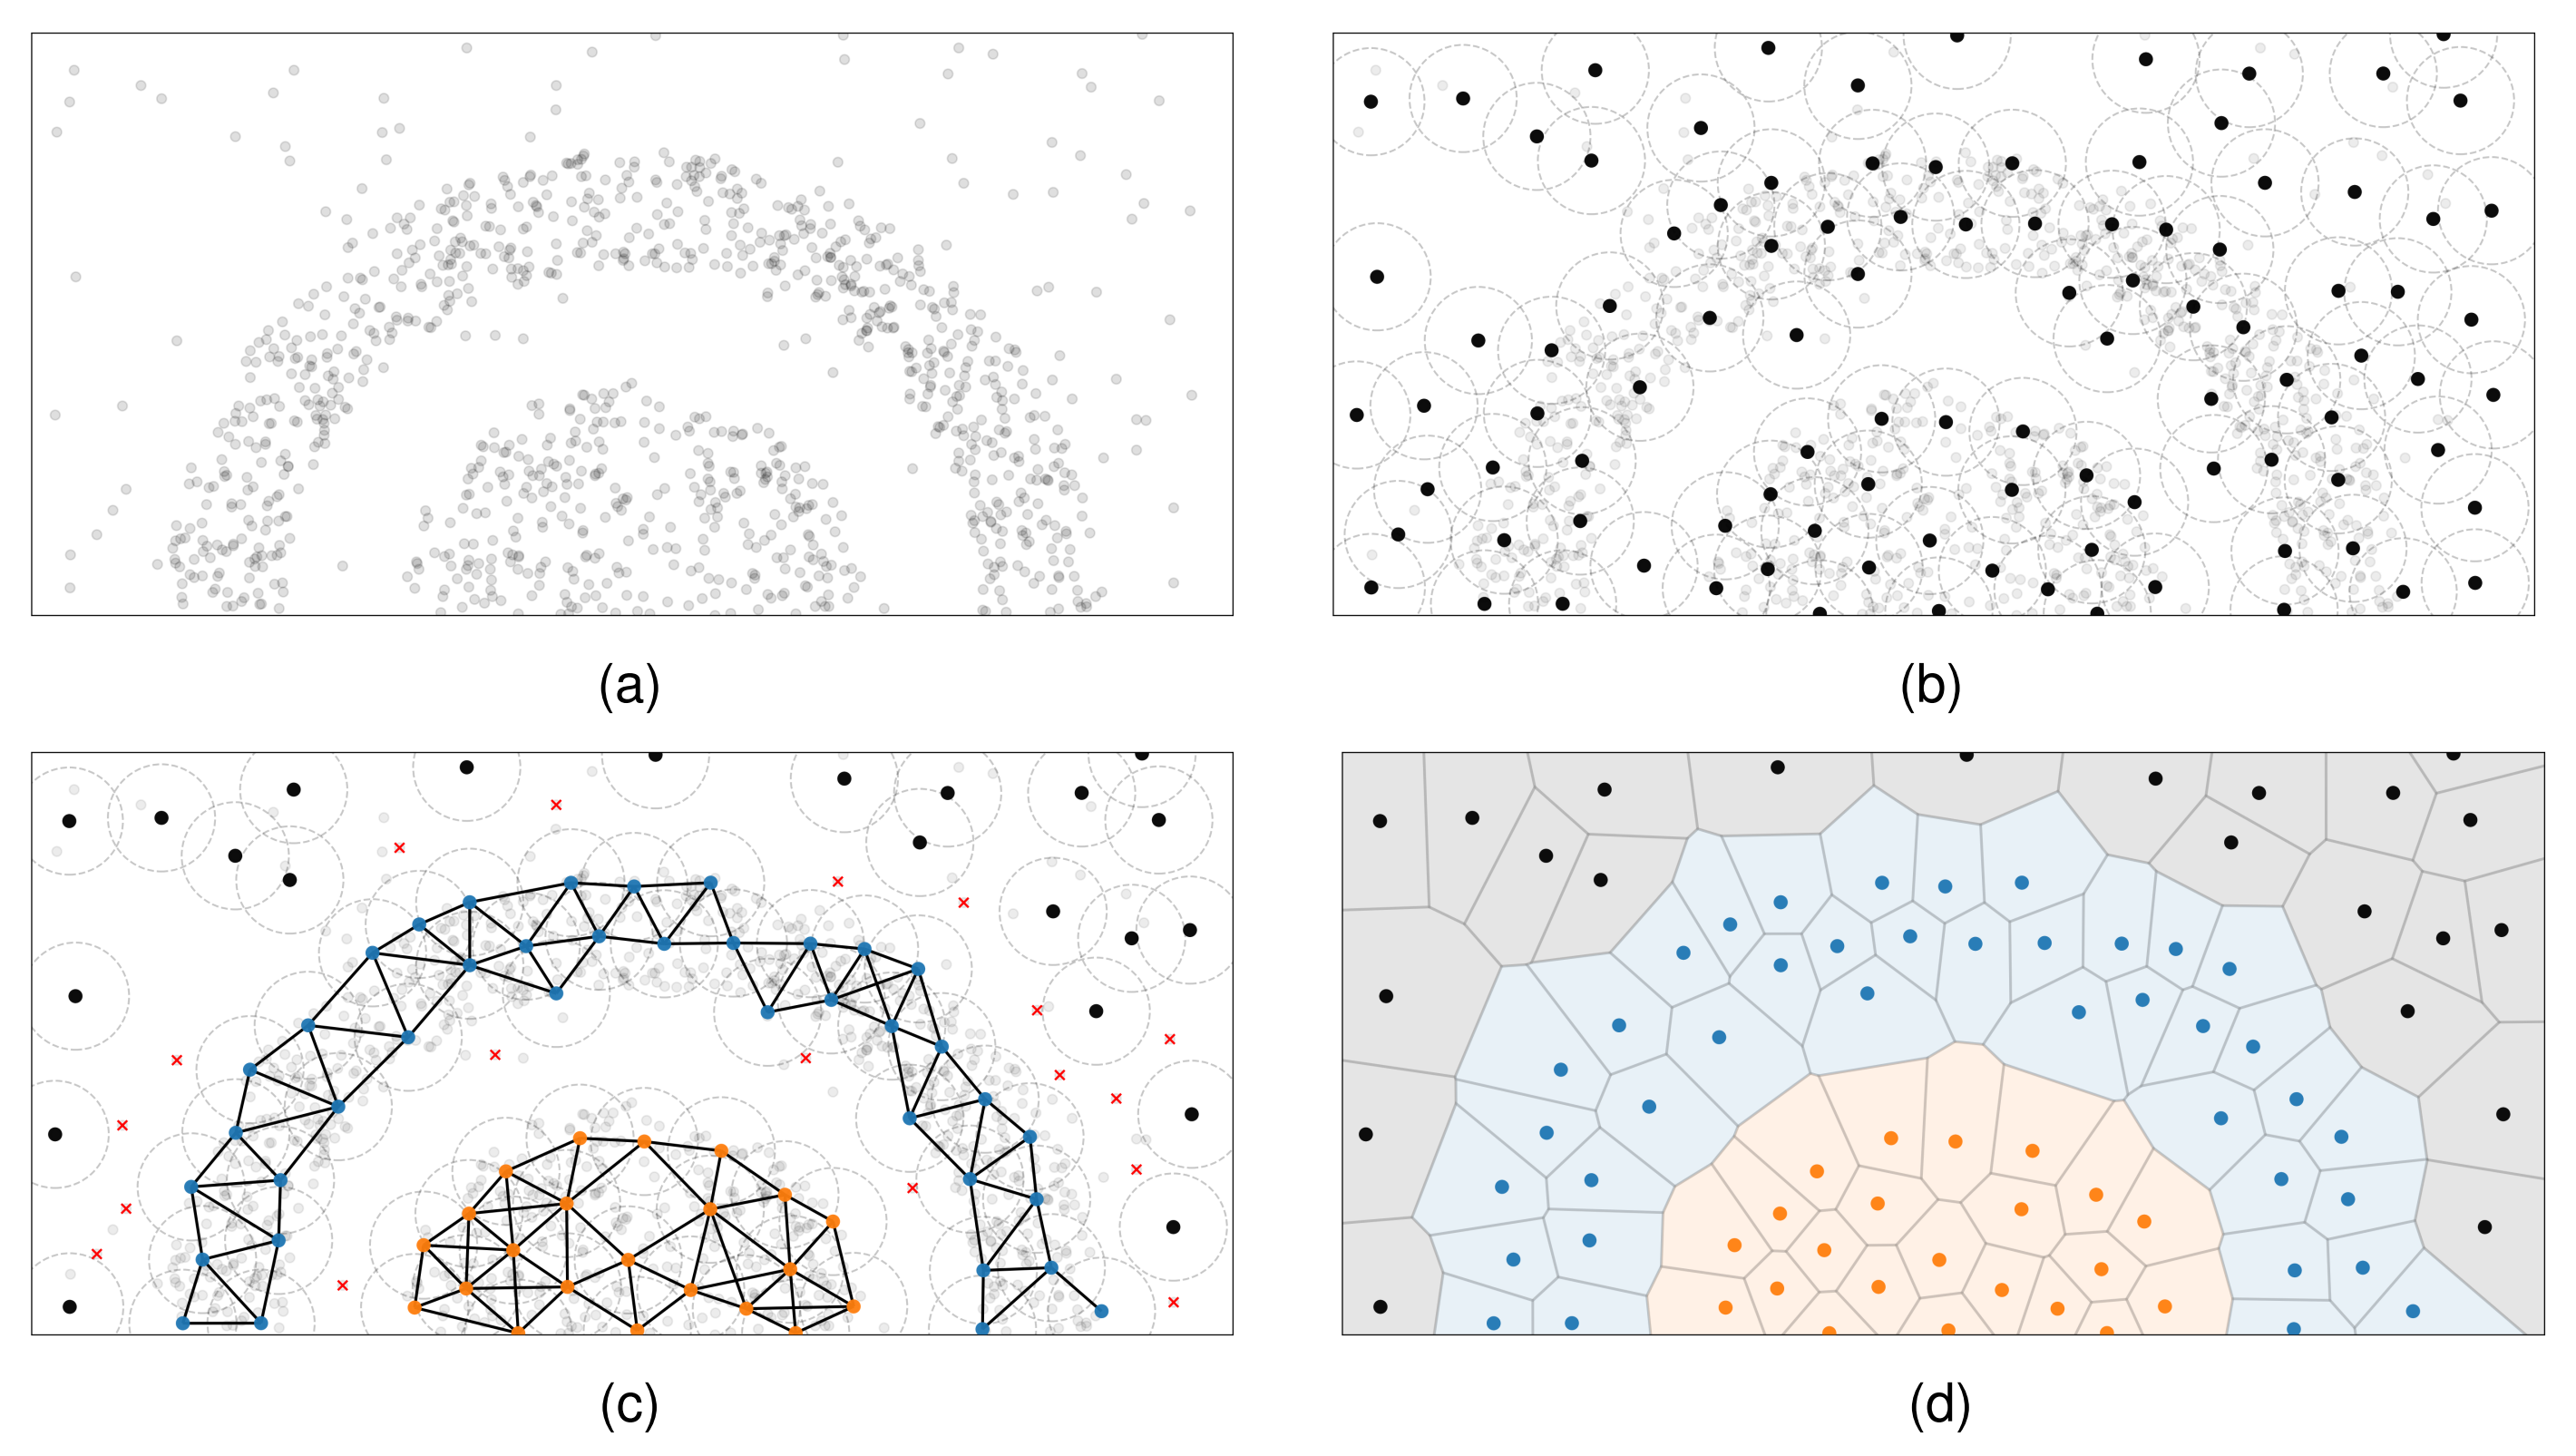
Voronoi Clustering (VoroClust) is a fast, density-based unsupervised clustering algorithm applicable to high-resolution and high-dimensional data. VoroClust runs as fast as distance-based clustering methods, while capturing complex regional geometries at least as well as current density-based methods. It uses a data-centered sphere cover to reduce computational demands, while still capturing data topology. It then propagates clusters outward from local peaks in density.
Although supervised machine learning is a powerful method for many applications, including image classification and segmentation, it requires comprehensive, consistent data sets, which many applications do not have. Unsupervised clustering algorithms analyze the structure of each dataset, rather than drawing on similarities with other examples, and are thus well suited for practical applications with data insufficient for, or inappropriate for, supervised learning.
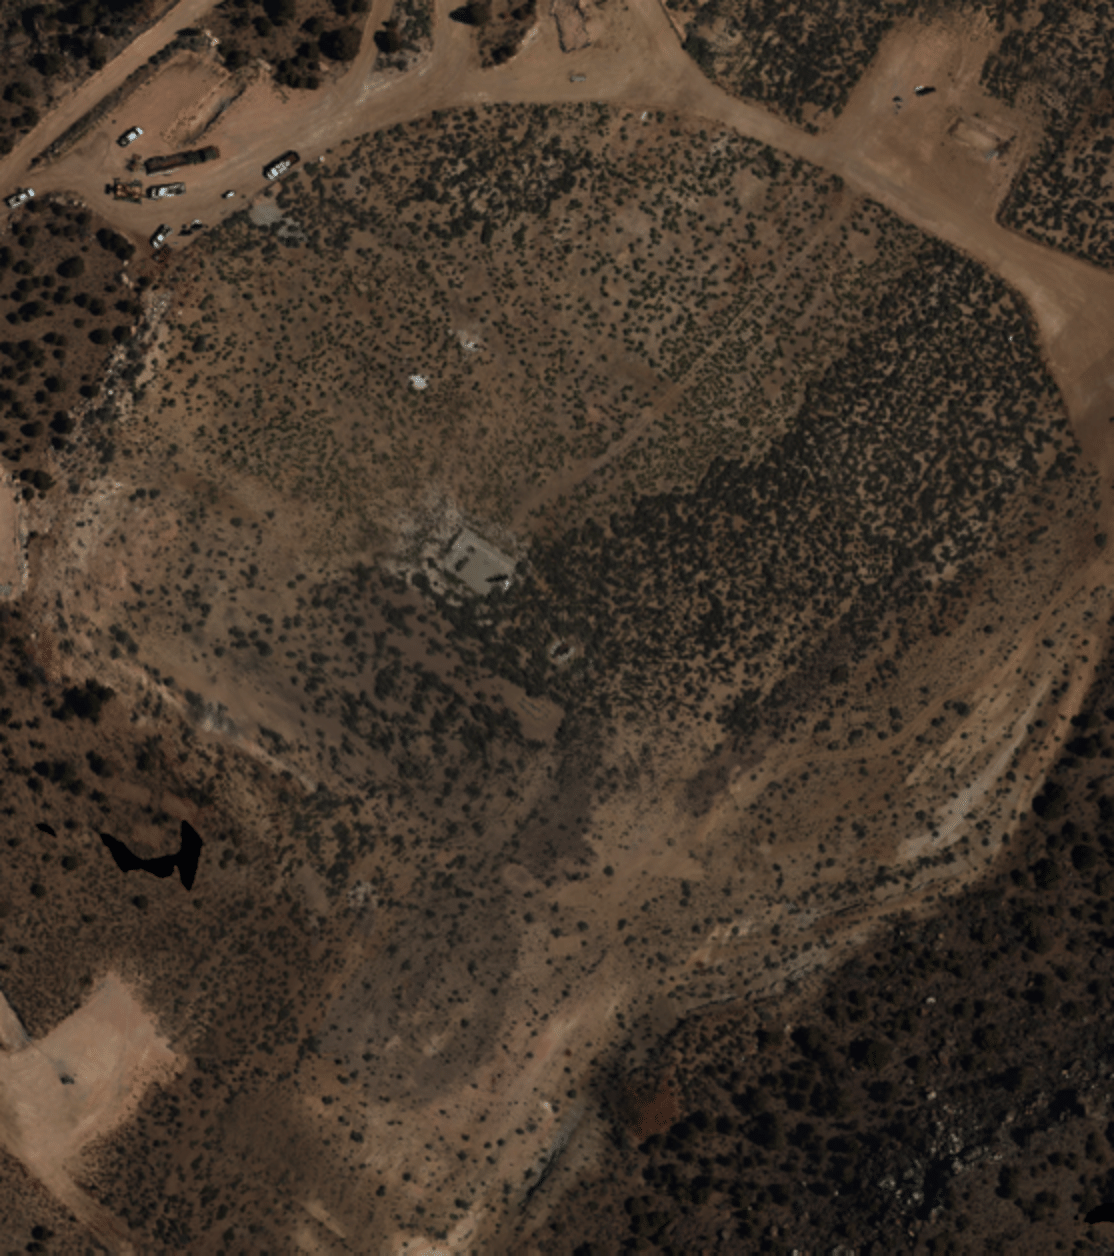
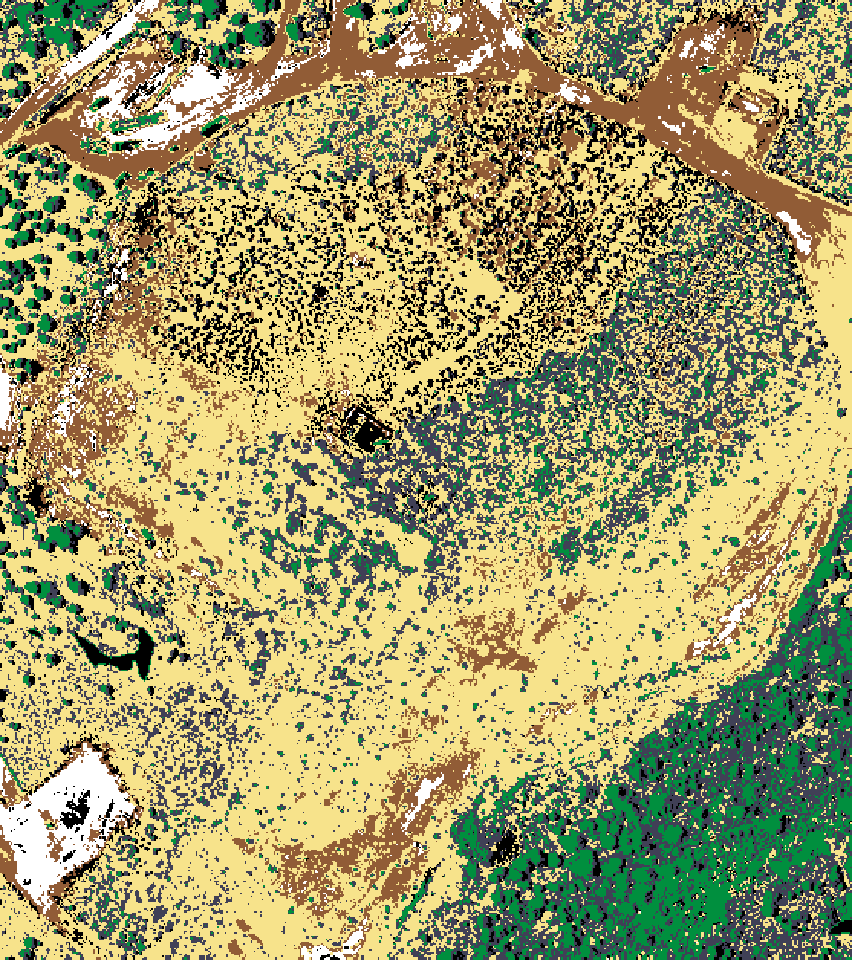
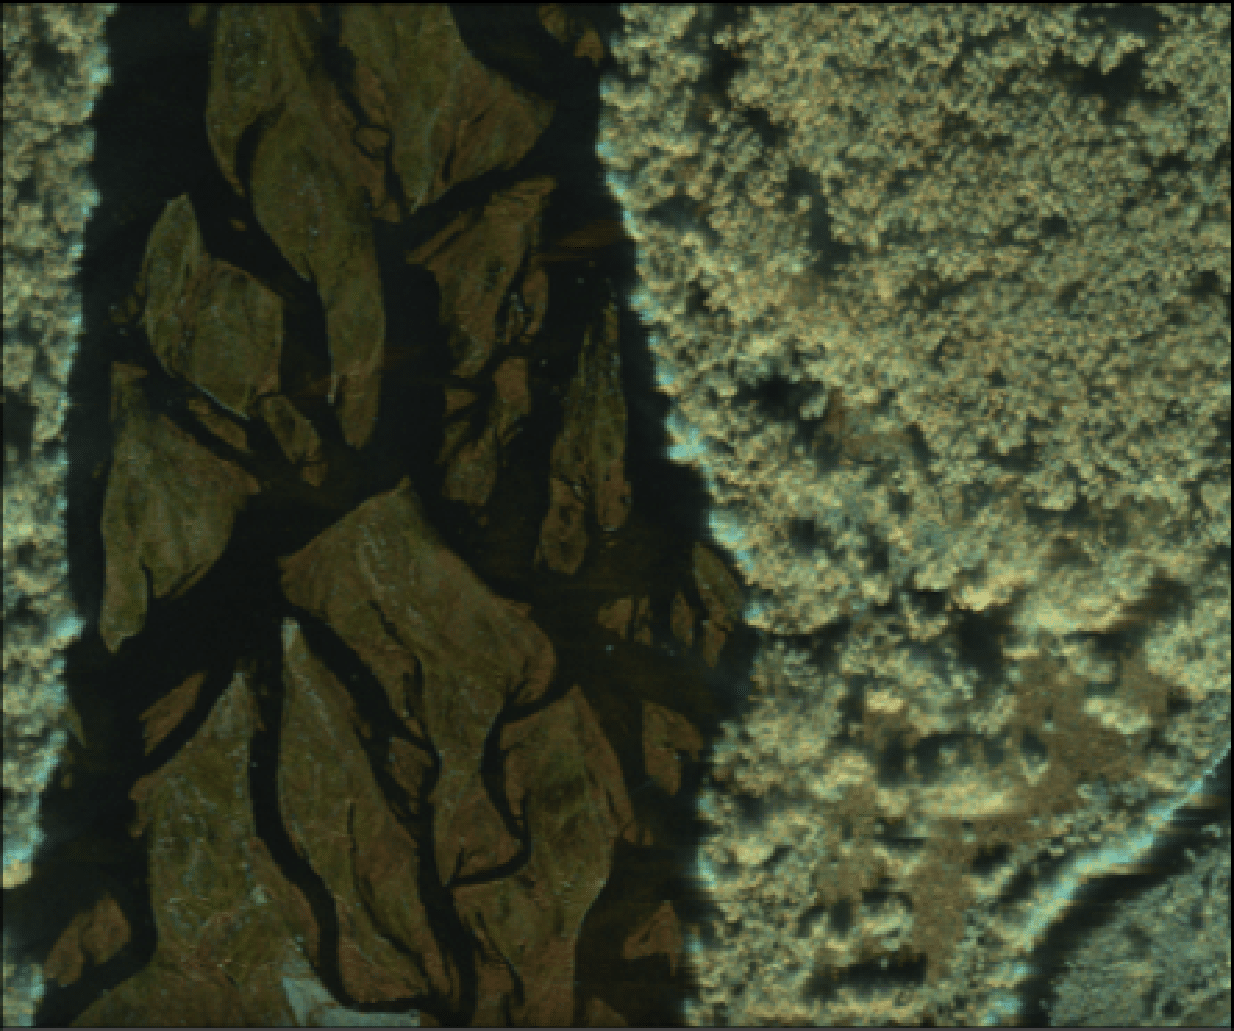
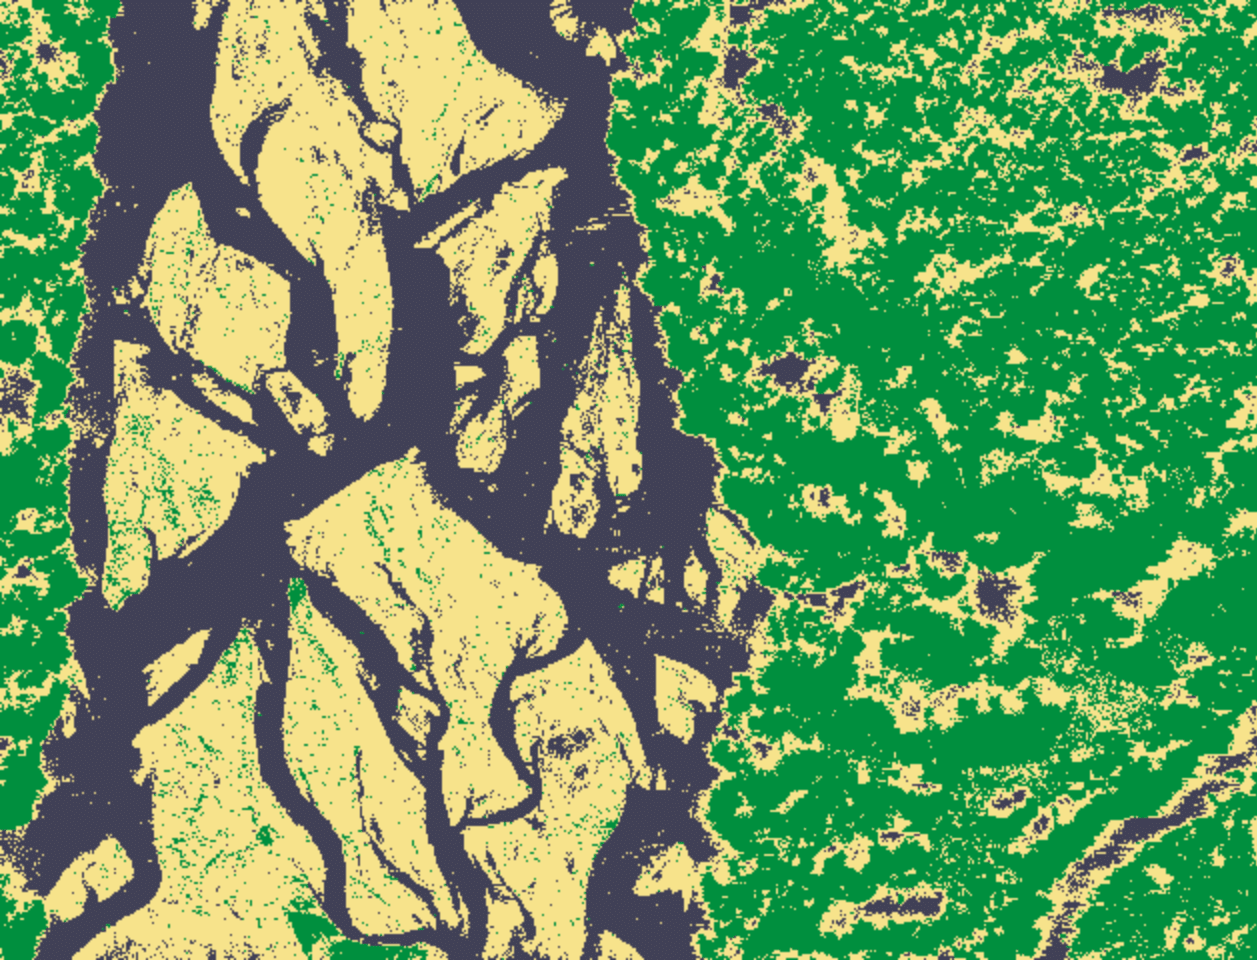
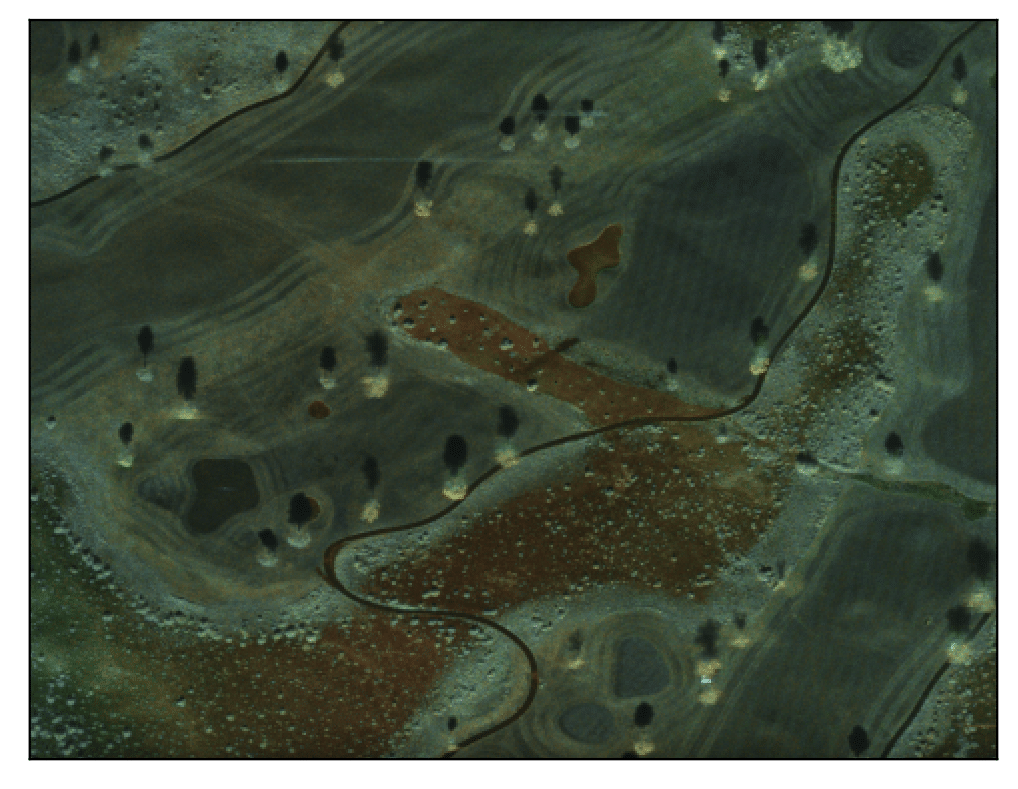
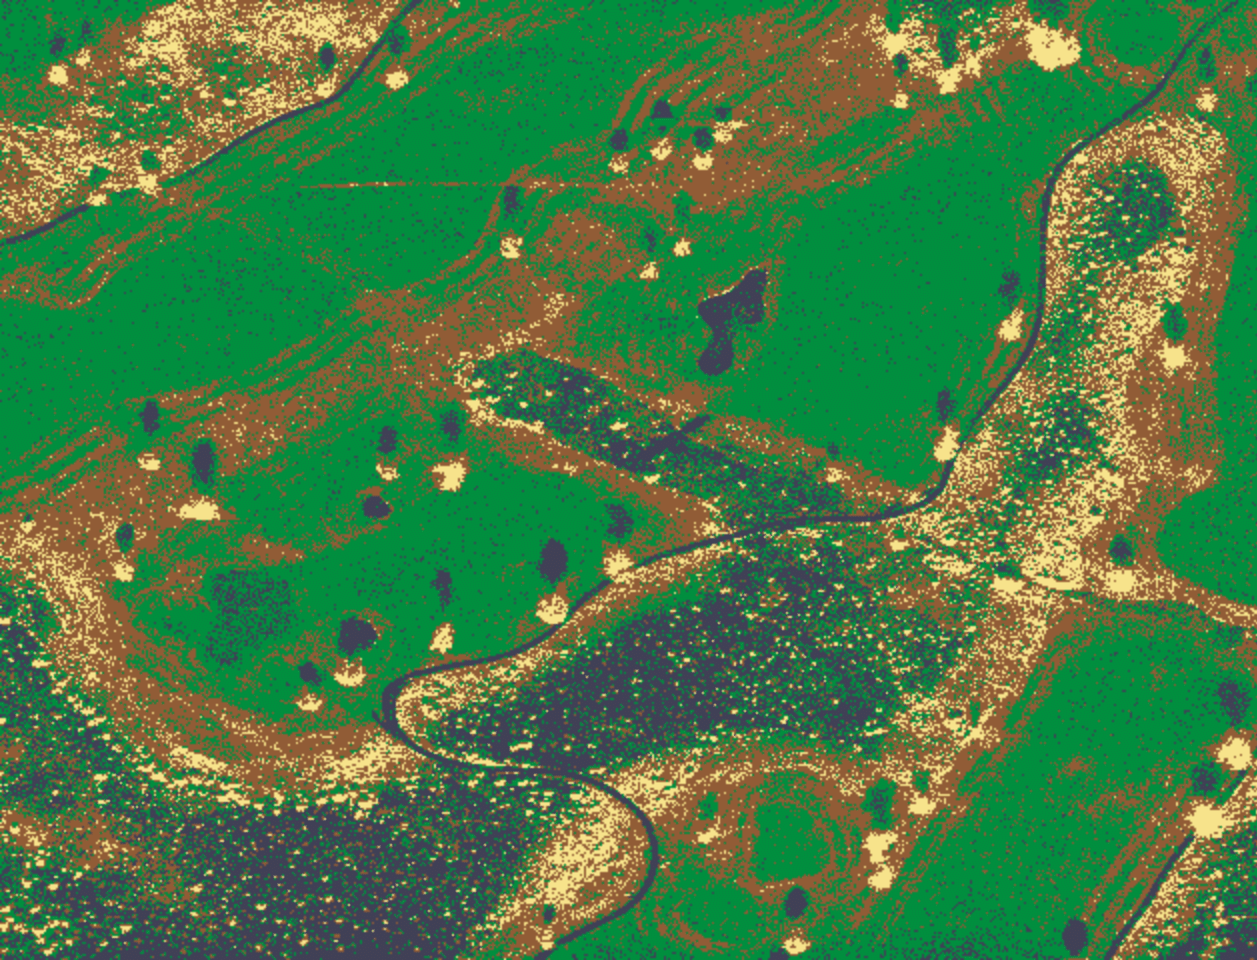
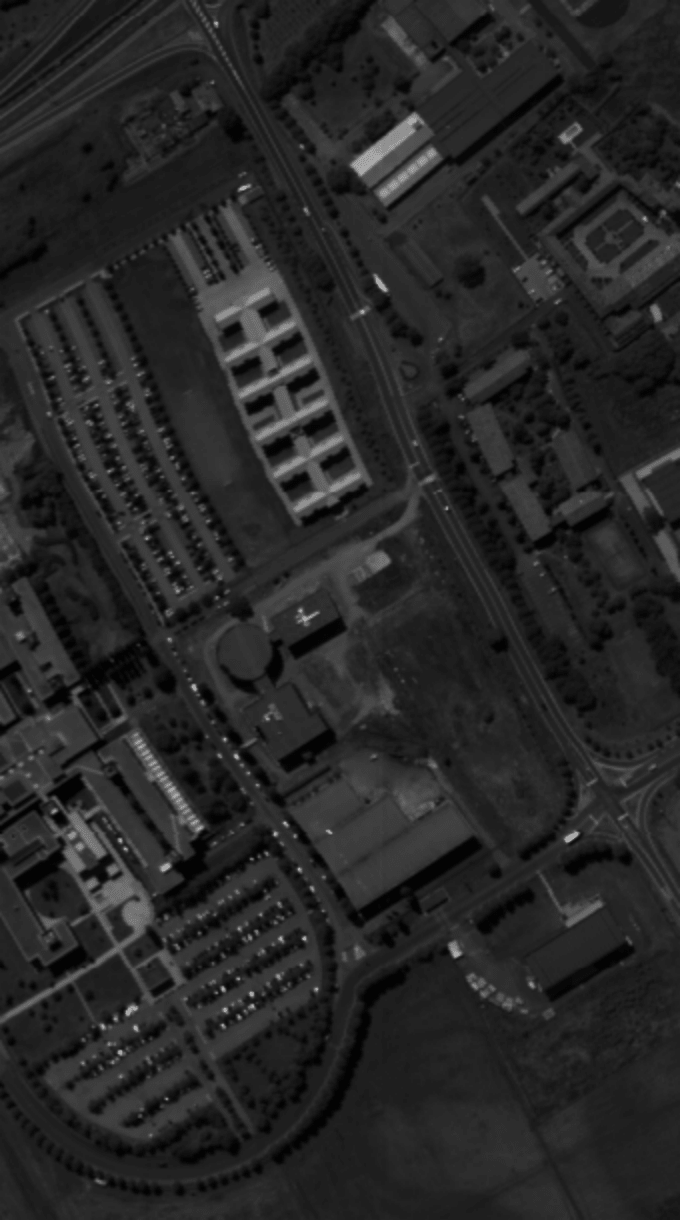
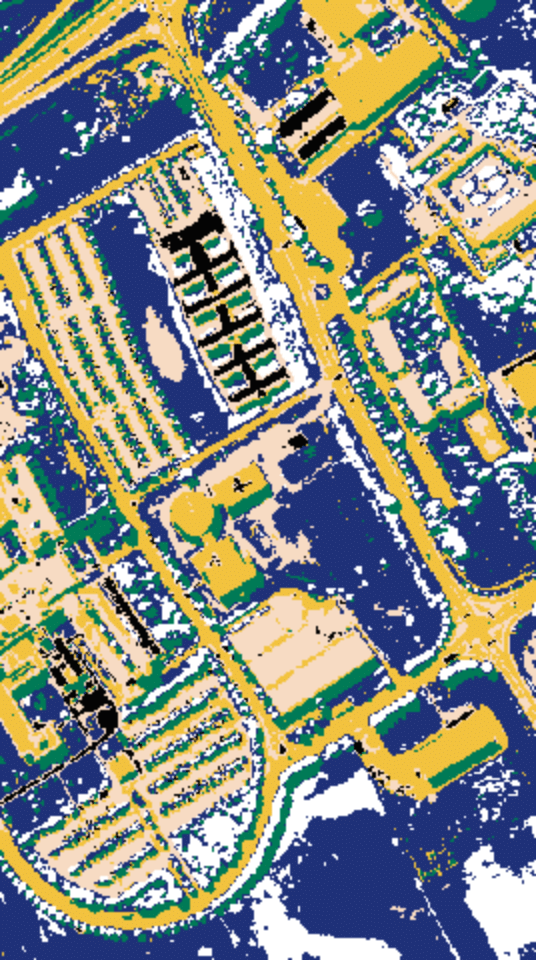
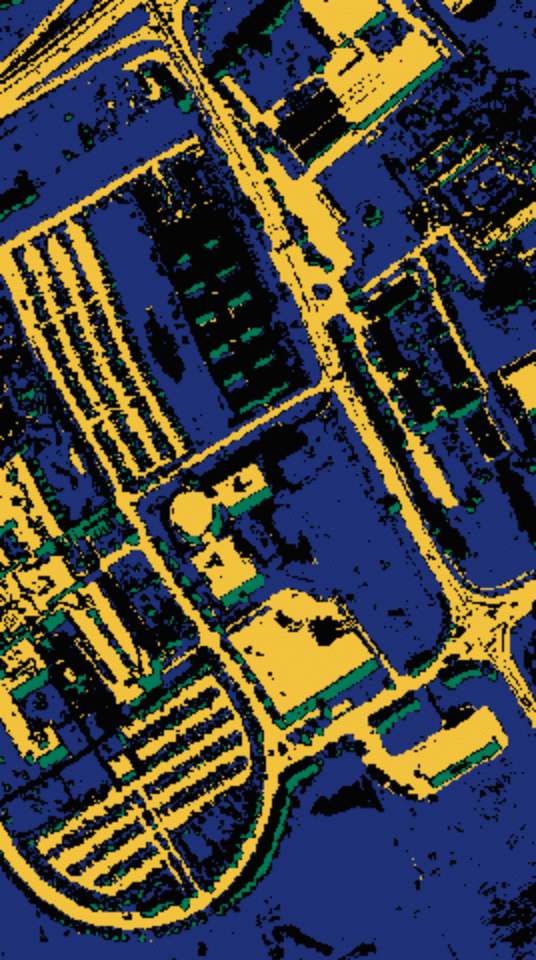
A first application for VoroClust is remote sensing. Remote-sensing datasets are expensive to collect, and each is acquired under different environmental conditions, or with significant variations in system operating parameters. Thus, clustering is appropriate. The VoroClust algorithm provides fast, state-of-the-art clustering results for both high-resolution polarimetric synthetic aperture radar (PolSAR) and high-dimensional hyperspectral imaging (HSI) datasets. Its cluster quality matches, or exceeds, the cluster quality of several established algorithms including k-Means++, BIRCH, DBSCAN, and HDBSCAN. VoroClust’s speed is more competitive with distance-based algorithms, such as k-Means++, than any of the existing density-based alternatives. Unlike distance-based approaches, however, VoroClust does not make simplifying assumptions on cluster geometry, and it provides noise and outlier information which k-Means++ cannot.
VoroClust is a general clustering tool and shows promising early results in non-imaging applications as well.
Results
